Real ai agent observability isn't a wall of dashboards you stare at — it's decision logs, staleness signals, and thresholds that only page a human when something actually needs one.
 ⊕ zoom
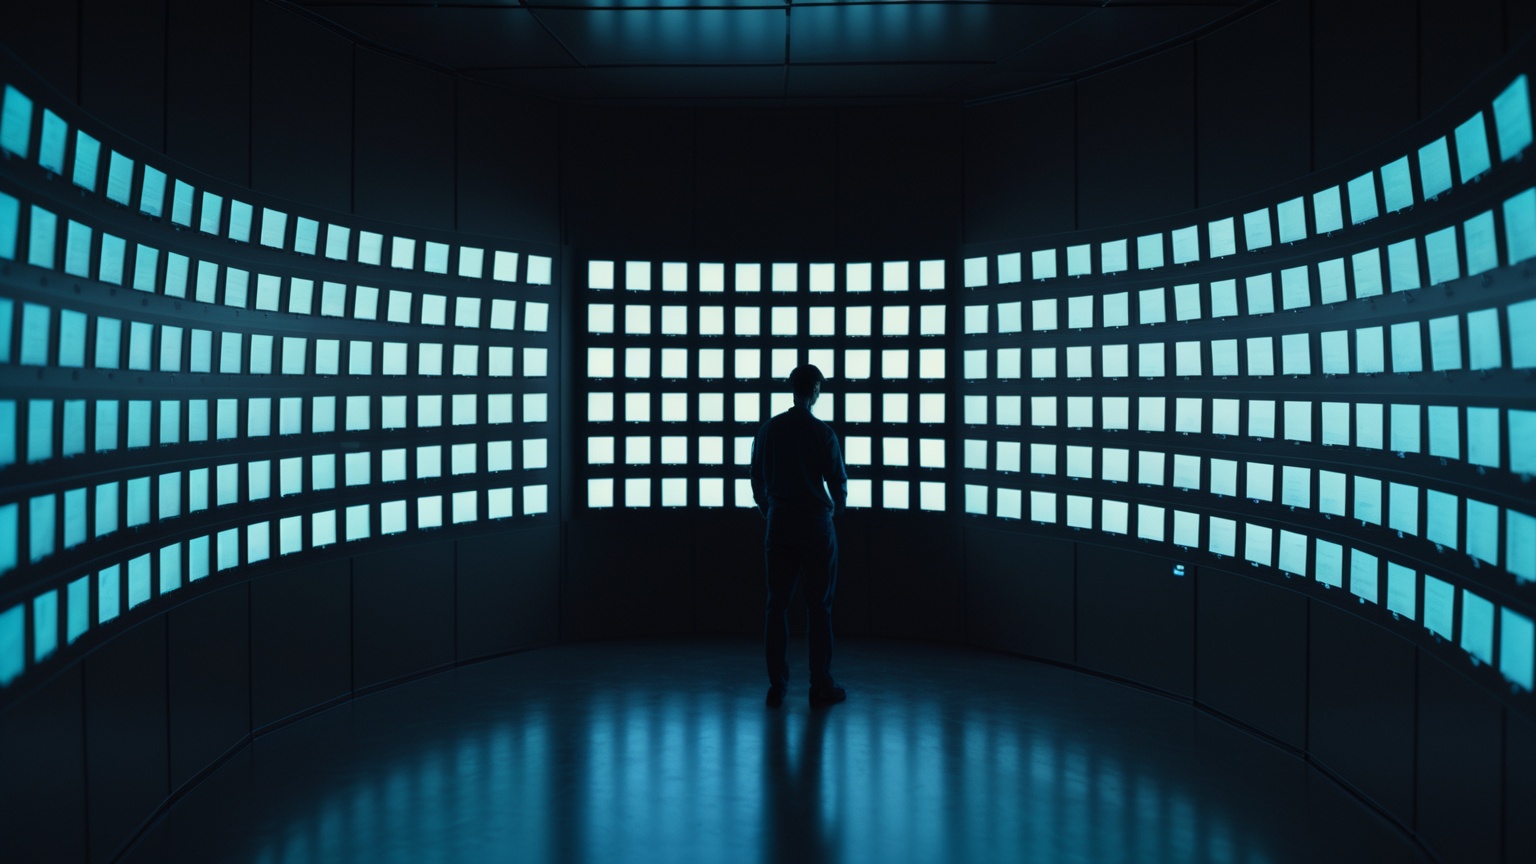
325 agents are running somewhere in this fleet right now, and I'm not watching any single one of them. That used to make me nervous. Now it's the entire point. Early on, I confused observability with a bigger dashboard — more panels, more real-time graphs, another tab open next to the terminal. That's not ai agent observability, that's just relocating the manual-watching problem from a log stream to a screen. The system I actually needed doesn't require me to look at it. It needs to tell me, unprompted, the one time in a thousand that something needs a human.
I've watched a Microsoft episode gesture at "feedback loops" for agents in the abstract — the AI should learn, the AI should improve, close the loop. True, and useless without a mechanism. At 325 agents you can't read every transcript, can't eyeball every heartbeat, can't manually correlate a cost spike with the run that caused it. You need a stack that watches on your behalf and only interrupts you when interruption is warranted. That's the actual engineering problem, and it looks nothing like a NOC wall of green lights.
The Difference Between "It's Running" and "It's Doing What It Should"
Uptime is the easiest signal to collect and the least useful one on its own. A process can hold a heartbeat, respond to health checks, and still be doing the wrong thing entirely — burning tokens on a task it should have escalated, looping on a tool call that keeps failing the same way, or quietly drifting off the instructions it was given three context-compactions ago. "Running" tells you the container didn't die. It tells you nothing about whether the agent's output is correct, its reasoning is sound, or its cost is proportional to the value it's producing.
This is the gap I lay out in more detail in AI Agents in Production: The Operator's Handbook — the handbook's core claim is that production readiness for agents means something structurally different than it does for a stateless API, and observability is where that difference shows up first. A REST endpoint either returns 200 or it doesn't. An agent can return 200 and still have made the wrong call three tool invocations upstream, and nothing in a standard uptime check will ever surface that.
Process health and behavioral correctness are different questions, answered by different signals. A green health check tells you the agent is alive. It tells you nothing about whether it's doing what you'd have wanted it to do if you'd been watching — which is exactly the thing you built the system so you wouldn't have to do.
What AI Agent Observability Actually Means at Fleet Scale
At the scale of a handful of agents, you can get away with reading transcripts. At 325, ai agent observability has to be a system, not a habit — four layers that each answer a different question, stacked so that only the top layer ever reaches you.
- Decision logging — what did the agent decide, and why, not just what it output.
- Health and staleness signals — is this agent alive and current, or alive and stuck.
- Alerting thresholds — which deviations are worth a human's attention, calibrated so they don't cry wolf.
- Escalation — a single path from "threshold tripped" to "a human sees exactly the right amount of context."
Each layer is built to filter, not to display. A dashboard shows you everything and asks you to find the problem. An observability stack finds the problem and shows you only that. That distinction is the whole difference between agent orchestration you can trust unattended and a fleet you're quietly re-checking by hand because you don't actually believe the monitoring.
Instrument, monitor, and debug agents at fleet scale. 7 lessons.
Start the Agent Observability track →Decision Logging: What the Agent Decided, Not Just What It Output
The single highest-leverage thing you can log is the decision, not the artifact. A commit message tells you what changed. It doesn't tell you the agent considered two approaches, picked the riskier one because it matched an existing pattern in the repo, and never surfaced that trade-off to anyone. Output-only logging makes every failure look like a surprise. Decision logging makes most failures look like exactly what they were: a reasonable-sounding call that turned out to be wrong, made visible enough that you could have caught it if you were looking at the right layer.
Practically, this means capturing the "why" alongside the "what" at every consequential branch point — which tool was chosen and which was passed over, which file was judged in-scope and which was deliberately left alone, what the agent flagged as uncertain versus what it treated as settled. That log doesn't need to be read live. It needs to exist, timestamped and queryable, so that when a threshold trips downstream you can walk backward to the decision that caused it instead of re-deriving it from the diff.
This is exactly the forensic trail I go looking for whenever something breaks — the failure modes I catalog in Why AI Agents Fail in Production almost never show up as a crash. They show up as a decision that was locally reasonable and globally wrong, and the only way to catch that class of failure after the fact is to have logged the reasoning, not just the result. Decision logs are also where guardrails earn their keep — a guardrail that blocks an action without recording why it fired is a guardrail you can't tune later.
Health and Staleness Signals
"Alive" and "current" are different properties, and conflating them is one of the more expensive mistakes in fleet monitoring. An agent can hold an open connection, respond to pings, and still be operating on state that's hours stale — a memory index that didn't reindex, a config that didn't reload, a context window still anchored to instructions that were superseded three tasks ago. It will look perfectly healthy on any check that only asks "are you there."
Staleness signals answer a different question: is what this agent believes to be true still true. That means timestamping the last successful state refresh per agent, not just the last heartbeat, and alerting on drift between those two numbers rather than on the heartbeat alone. A five-minute-stale cache is often fine. A five-hour-stale one, on an agent making autonomous decisions the whole time, is a very different risk profile — and a pure uptime check can't tell you which one you have.
The wall of monitors doesn't feed a screen — it feeds a threshold engine, and the threshold engine stays silent by design. Five signal types, one narrow gate, and a human only ever sees the output of that gate: a single page with the signal that fired, the decision log entries that led to it, and a diff, not a login prompt into 325 separate agent sessions.
Alerting Thresholds That Don't Cry Wolf
A threshold that fires on every anomaly is a threshold nobody trusts by week two. This is the fastest way to destroy an observability system: page a human for something that turns out to be nothing, three times in a row, and every subsequent page gets a slower, more skeptical response — right up until the one that mattered gets the same treatment. Calibrating thresholds is less about picking the right number and more about picking the right baseline to deviate from, per agent, per task type, updated as the fleet's normal shifts.
That's a real operational discipline, not a one-time config. I go into what actually changes once agents are live — as opposed to what you assumed would hold from the design phase — in Running AI Agents in Production: Why Building Was the Easy Part. Thresholds set on day one against a fleet of 20 agents don't hold at 325; cost baselines that were reasonable for one workload look like a spike for another, and an alerting system that doesn't account for that will either go silent from alert fatigue or bury you in noise until you tune it out entirely. Human-in-the-loop only works if the loop is rare enough that a human actually closes it every time it opens.
Escalate to Human, Not to a Dashboard
The end state of ai agent observability isn't a control room. It's a Slack message, a page, or a single Mission Control card that shows up exactly when it's warranted and stays quiet the rest of the time. I learned this the hard way building the broker layer that lets the fleet actually talk to itself — the session I wrote up in Deployed Is Not Operational: The Session That Made 24 Agents Actually Talk was, underneath the auth bugs and the label mismatches, an observability failure first. The dashboard said "connected." Nothing was actually flowing. A system that reports its own status honestly is a prerequisite for a system you can safely not watch.
The same principle scales past a single fleet. tesseractintelligence.io runs on the same premise applied to trading infrastructure — the signal that matters isn't "is the bot running," it's "is the bot doing the thing it's supposed to be doing, and will it tell someone the moment it isn't." Whether the domain is code agents or trading agents, the engineering is the same discipline: build the system to interrupt you, not the other way around.
Start Watching the Right Layer
None of this requires exotic infrastructure. It requires deciding, deliberately, which layer gets logged, which deviations are worth a threshold, and which threshold trips are worth a human's attention — then building the escalation path so the answer to all three questions is enforced in code, not in habit. The quality-check skill is a good place to see this pattern in miniature: it scans a codebase, ranks the riskiest untested paths, and hands you a prioritized list instead of a wall of raw coverage numbers. Same filtering instinct, smaller scope.
Start with the 7 free skills at jeremyknox.ai/skills-library — no signup.
The engineering patterns in this article are covered in the AI Infrastructure track — persistent platforms that run themselves. 11 lessons.
Start the AI Infrastructure track →Explore the Tesseract Labs Ecosystem
Follow the Signal
If this was useful, follow along. Daily intelligence across AI, crypto, and strategy — before the mainstream catches on.
5 AI Agent Design Patterns That Survive Production
Tool-use, planning, multi-agent handoff, human-in-the-loop escalation, and verification gates — the five AI agent design patterns everyone teaches — look identical in a course slide. Under real traffic they behave nothing alike, and each one guards against one specific failure.
The AI Agent Tech Stack Behind 325 Agents in Production
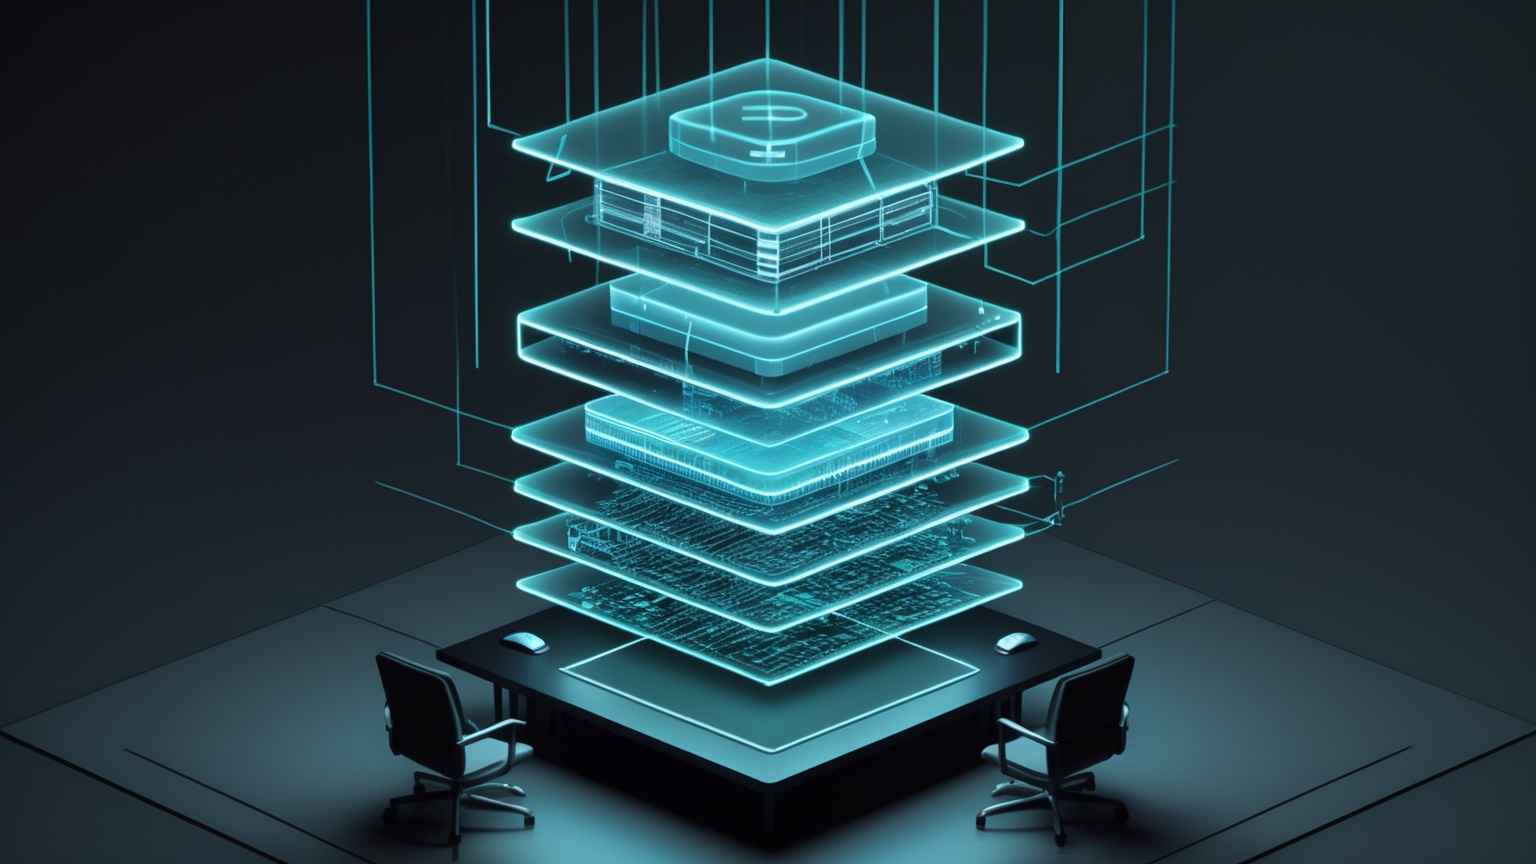
A Reddit thread ranking #1 for the exact question — what tools to use to build AI agents — is mostly vendor noise. Here's the actual AI agent tech stack running 325 agents in production, layer by layer.
AI Agents in Production: The Operator's Handbook
Everyone teaches building agents. Almost nobody teaches running ai agents in production — the operational discipline that separates a demo from a fleet that survives contact with reality.